
BIND 9
(Part 2 - Long-Term Statistics Monitoring and Log Analysis)
Carsten Strotmann and the ISC Team
Created: 2021-03-17 Wed 14:18
All content © 2021 Internet Systems Consortium, Inc.
Welcome
Welcome to part two of our BIND 9 webinar series
All content © 2021 Internet Systems Consortium, Inc.
In this Webinar
- Identifying outliers in BIND 9 logfiles
- BIND 9 monitoring from the
named.statsfile - BIND 9 monitoring with the statistics channel
- Using open source tools to store and display metrics
- Using open source tools to search and analyze logs
- BIND 9 logs and remote syslog best practice
- Best practices for metrics to monitor for authoritative and recursive
All content © 2021 Internet Systems Consortium, Inc.
Goals of monitoring
- finding outliers / anomalies -> potential security or performance problem
- observe change in traffic patterns
- observe change in load (CPU load, traffic load etc)
- observe change in protocol use (new resource records, IPv4 vs. IPv6 usage, UDP vs. TCP usage, DoH/DoT usage)
All content © 2021 Internet Systems Consortium, Inc.
Identifying outliers in BIND 9 logfiles
All content © 2021 Internet Systems Consortium, Inc.
Outliers
- outliers in log-files are entries that do not appear during normal operation
- one approach to catch outliers is called Artificial Ignorance
- it is not the only approach
- works best for small to medium size installations
- first described by Security researcher Marcus J. Ranum ("artificial ignorance: how-to guide" https://www.ranum.com/security/computer_security/papers/ai/)
All content © 2021 Internet Systems Consortium, Inc.
Artificial Ignorance
- the concept of AI (Artificial Ignorance)
- there are two types of log messages
- the ones the admin does not care about and do not need attention
- the ones the admin does care about and need attention
- there are two types of log messages
All content © 2021 Internet Systems Consortium, Inc.
Artificial Ignorance - Messages that do not need attention
- the log messages that the admin does not care about and do not
need attention are noise
- it might be still valid to collect these messages in the logs, for example for statistical analysis
- so the AI system will filter them (suppress them)
- what are left are, by definition, the messages that do need attention
All content © 2021 Internet Systems Consortium, Inc.
Artificial Ignorance - Messages that do need attention
- the messages that are passing the filter fall in two categories
- new messages that are not indicating a security or performance issue
- a new filter (usually a regular expression) needs to be added to the software to hide this type of message in the next run
- new messages that do indicate a potential security or
performance issue
- the admin needs to investigate the root case of the messages and need to fix the cause for the log messages
- new messages that are not indicating a security or performance issue
All content © 2021 Internet Systems Consortium, Inc.
Artificial Ignorance - operation
- the AI software is run periodically (every 24 hours, every hour),
the results are send via mail (chat etc) to the group of
administrators
- in the ideal case, the mail message will have no new log
messages
- the mail (chat etc) should be send even if no new information is available
- in case a log message appears, it must be dealt with until the next run of the software (internal SLA)
- in the ideal case, the mail message will have no new log
messages
All content © 2021 Internet Systems Consortium, Inc.
Artificial Ignorance - Software
- there are several implementations of "Artificial Ignorance"
available
- log templater (TMPLTR): http://www.uberadmin.com/Projects/logtemplater/index.html
- NBS (never before seen): https://www.ranum.com/security/computer_security/code/
- Log message classification with syslog-ng https://lwn.net/Articles/369075/
All content © 2021 Internet Systems Consortium, Inc.
Artificial Ignorance - additional information
- System Logging and Log Analysis (Marcus J. Ranum): https://www.ranum.com/security/computer_security/archives/logging-notes.pdf
- Syslog normalization https://rainer.gerhards.net/2010/02/syslog-normalization.html
- Building a 100K log/sec system (David Lang / Intuit) http://talks.lang.hm/talks/topics/Logging/LISA_2012/logging_paper_slides.pdf
All content © 2021 Internet Systems Consortium, Inc.
BIND 9 monitoring from the "named.stats" file
All content © 2021 Internet Systems Consortium, Inc.
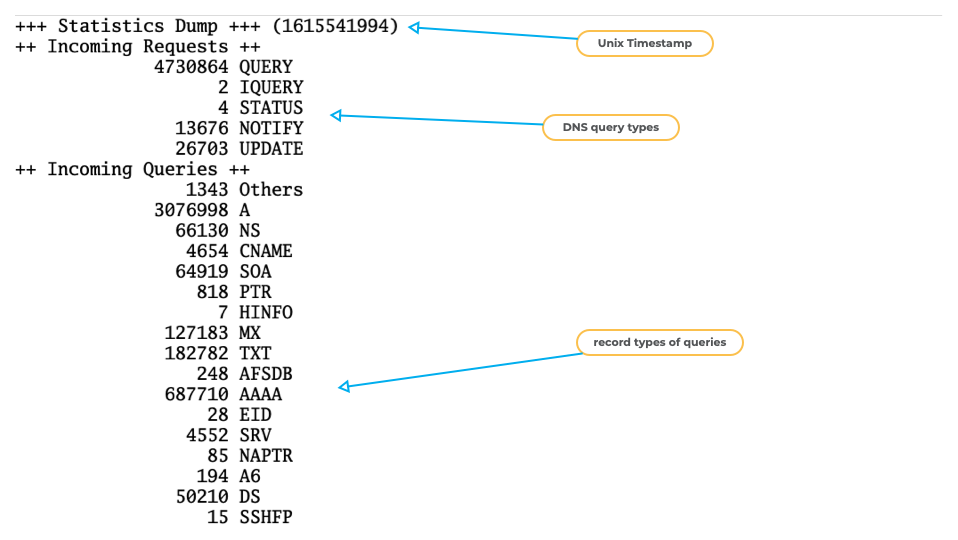
BIND 9 "named.stats"
- the command
rndc statswill trigger a BIND 9 server to write a file with internal statistics- the statistics content is written to the file
named.statsin the BIND 9 servers home directory - the directory and the name of the file can be changed in the
BIND 9 configuration file
named.confwith thestatistics-filedirective
- the statistics content is written to the file
All content © 2021 Internet Systems Consortium, Inc.
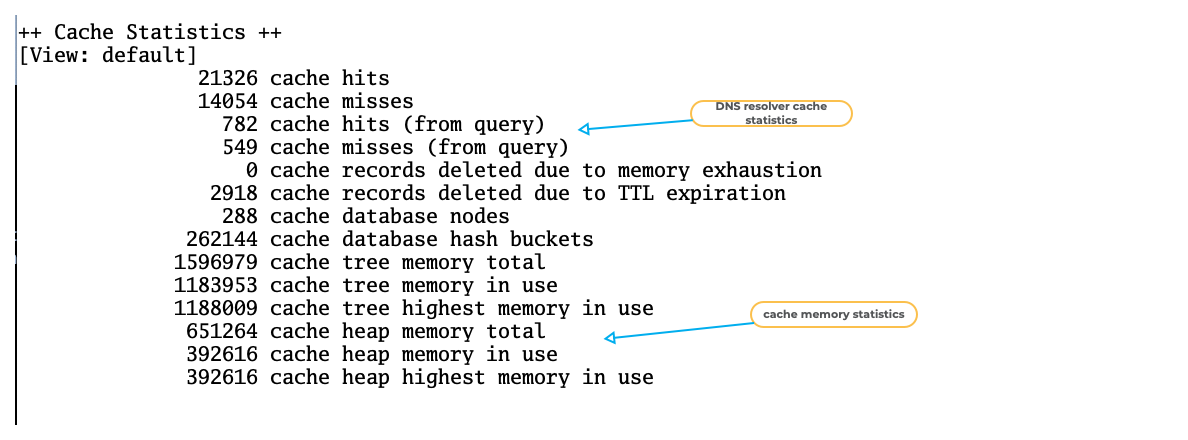
BIND 9 "named.stats" example (1)
All content © 2021 Internet Systems Consortium, Inc.
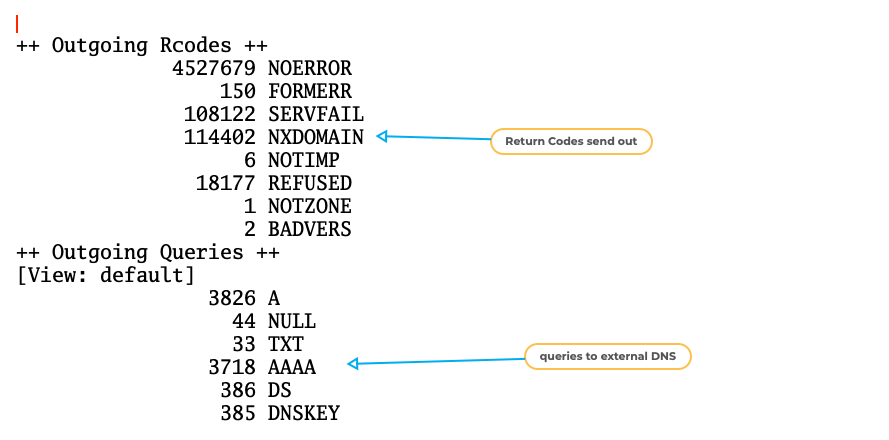
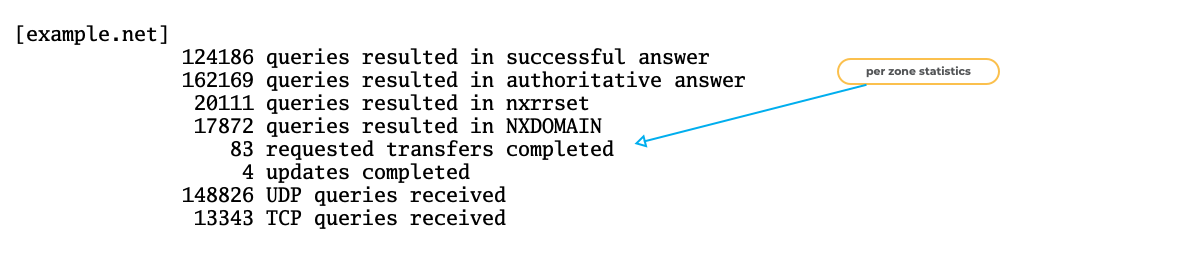
BIND 9 "named.stats" example (2)
All content © 2021 Internet Systems Consortium, Inc.
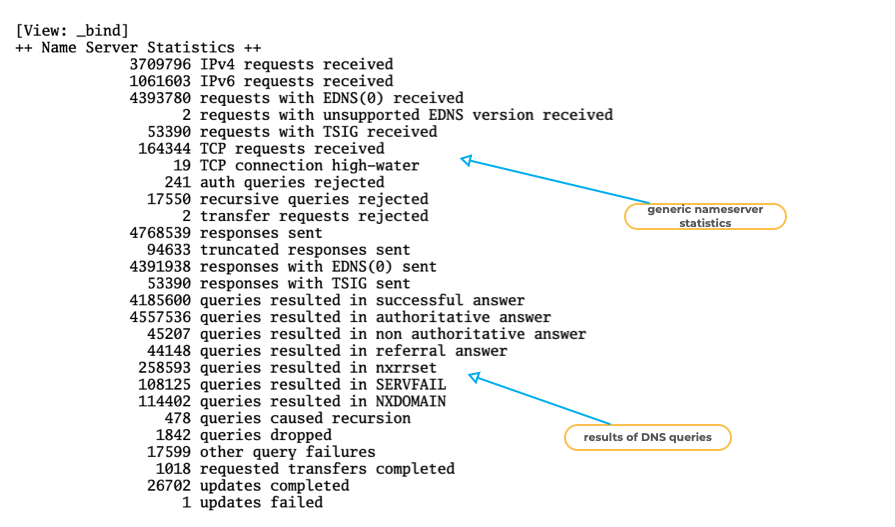
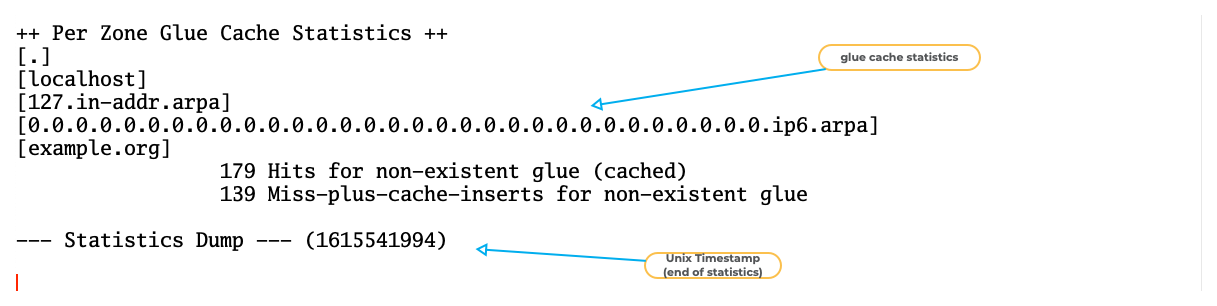
BIND 9 "named.stats" example (3)
All content © 2021 Internet Systems Consortium, Inc.
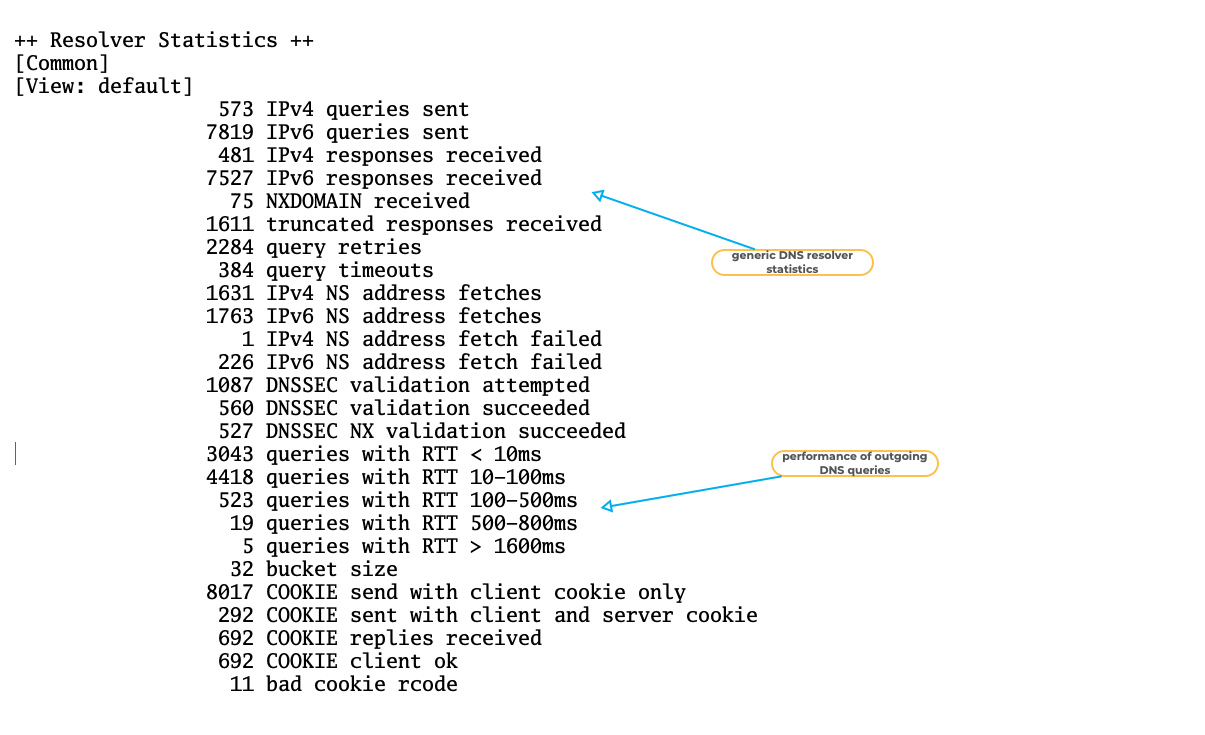
BIND 9 "named.stats" example (4)
All content © 2021 Internet Systems Consortium, Inc.
BIND 9 "named.stats" example (5)
All content © 2021 Internet Systems Consortium, Inc.
BIND 9 "named.stats" example (6)
All content © 2021 Internet Systems Consortium, Inc.
BIND 9 "named.stats" example (7)
All content © 2021 Internet Systems Consortium, Inc.
Zone-Statistics
Zone statistics need to be enabled in the BIND 9 configuration file
named.conf- the statement
zone-statistics yes;inside theoptionsblock enables the zone statistics for all zones
options { [...] zone-statistics yes; };- the statement
All content © 2021 Internet Systems Consortium, Inc.
Zone-Statistics
- It is also possible to enable the zone statistics only for
selected zones
- This is done with the statement
zone-statistics yes;inside thezoneblock:
- This is done with the statement
zone "example.org" in {
     type primary;
     file "primary/example.org";
     zone-statistics yes;
};
All content © 2021 Internet Systems Consortium, Inc.
Monitoring with "named.stats"
- many popular monitoring tools offer modules to use the data in
the
named.statsfile- LibreNMS https://www.librenms.org/
- Nagios https://www.nagios.org/
- Icinga https://icinga.com/
- Prometeus https://prometheus.io/
- NetData https://www.netdata.cloud/
- many more
All content © 2021 Internet Systems Consortium, Inc.
Challenges with "named.stats"
- BIND 9 will always append new statistics to the
named.statsfile, the file will always grow- the file should be purged from time to time, as monitoring plugins usually read the file from the beginning to find the latest information
- the
named.statsfile contains human readable data, which needs to be parsed by a tool- the contents of
named.statscan change with new BIND 9 releases, the monitoring plugins might fail when the parser is not well written.
- the contents of
All content © 2021 Internet Systems Consortium, Inc.
BIND 9 monitoring with the statistics channel
All content © 2021 Internet Systems Consortium, Inc.
BIND 9 http statistics channel
- The BIND 9 statistics can also be retrieved from a running BIND 9
server via the http protocol
- BIND 9 has a tiny build-in web-server
- It provides the statistics data in XML or JSON format
All content © 2021 Internet Systems Consortium, Inc.
BIND 9 statistics channel vs. "named.stats"
- The BIND 9 statistics channel has some benefits compared to the
older
named.statsstatistics- The statistics can be read over the network
- The statistics comes in structured data (XML or JSON) that is parse-able by software (more robust monitoring)
- The format of the statistics data is versioned
- A change in the statistics format will not break existing tools
All content © 2021 Internet Systems Consortium, Inc.
BIND 9 statistics channel dependencies
- In order to provide the statistics data over XML, BIND 9 must be compiled with libxml2 support
- For JSON output, the BIND 9 server needs to be compile with support for json-c (https://github.com/json-c/json-c/wiki)
- The ISC BIND 9 packages contain the XML and JSON functions: https://kb.isc.org/docs/isc-packages-for-bind-9
All content © 2021 Internet Systems Consortium, Inc.
BIND 9 statistics channel configuration
- The BIND 9 statistics channel is enabled in the BIND 9
configuration file
named.conf- Zone statistics can be enabled with the same statements used
for the
named.statsstatistics - It has its own configuration block
- Zone statistics can be enabled with the same statements used
for the
statistics-channels {
     inet 192.0.2.53 port 8053 allow { localhost; adminnets; };
     inet fd00::1053 port 8053 allow { fd00::/64; };
};
All content © 2021 Internet Systems Consortium, Inc.
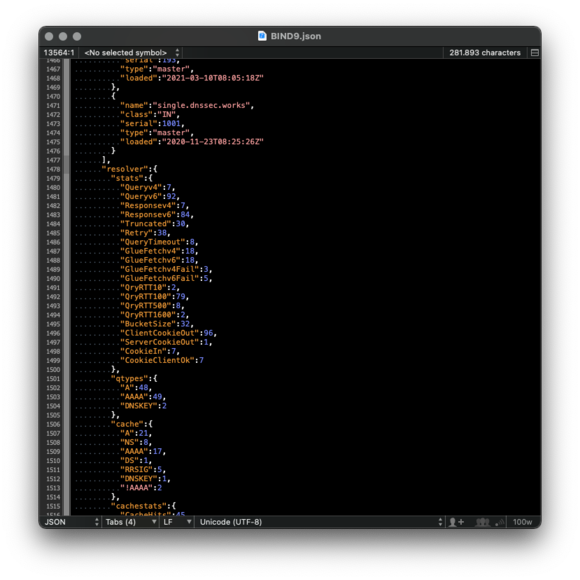
BIND 9 statistics channel
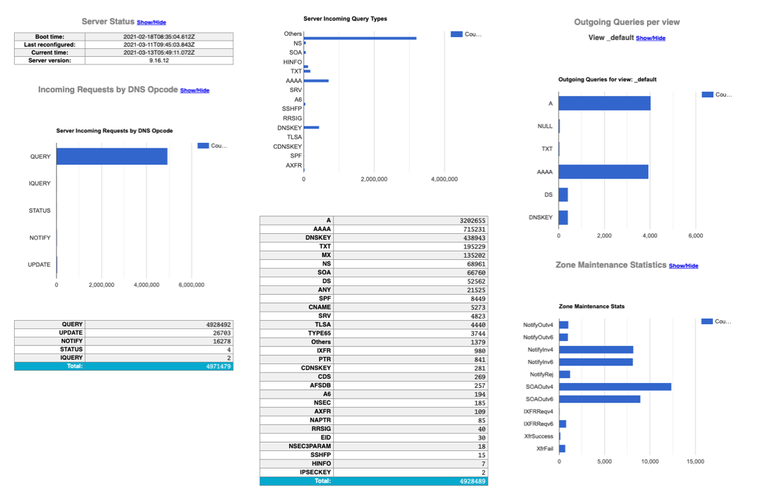
All content © 2021 Internet Systems Consortium, Inc.
JSON Statistics
- JSON (JavaScript Object Notation) is an open standard file format
that uses human-readable text
- JSON is faster to parse than XML
- Some (many?) people find JSON easier to work with compared to XML
All content © 2021 Internet Systems Consortium, Inc.
BIND 9 statistics channel
All content © 2021 Internet Systems Consortium, Inc.
Security recommendations for the statistics channel
- The BIND 9 statistics channel should not be exposed to the open
Internet without authentication
- It reveals internal information that can be use to attack the DNS server
- It increases the attack surface
- Best practices
- Bind the statistics channel only to internal management networks
- Protect the BIND 9 statistics channel with a reverse web proxy (NGINX, Caddy, OpenBSD httpd etc) with basic authentication or TLS client certificate authentication
All content © 2021 Internet Systems Consortium, Inc.
Additional information on the statistics channel
- Operating statistics provided by BIND statistics channels https://kb.isc.org/docs/aa-01123
- Using BIND's XML statistics-channels https://kb.isc.org/docs/aa-00769
All content © 2021 Internet Systems Consortium, Inc.
Using open source tools to store and display metrics
All content © 2021 Internet Systems Consortium, Inc.
Prometheus
- Prometheus is a popular monitoring solution
- Open source: Apache 2 license
- Homepage: https://prometheus.io/
- Prometheus is easy to deploy and scales from small to large networks
All content © 2021 Internet Systems Consortium, Inc.
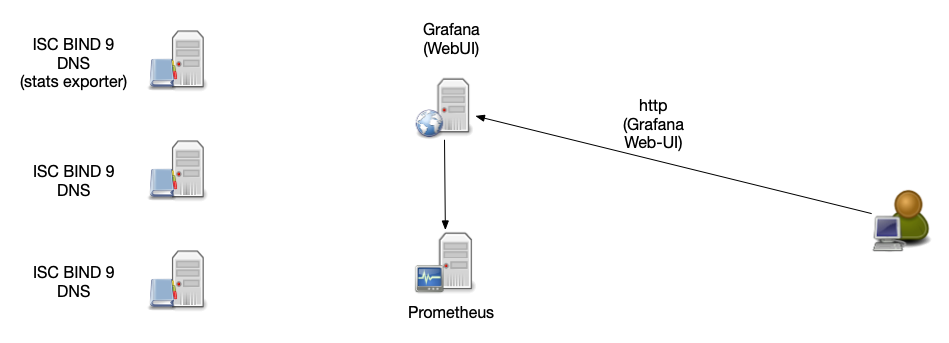
Prometheus architecture
- small agent programs (called "exporters") collect data
- exporters offer the data over http in a key/value format
- easy to test the correct function of an agent with a
web-browser of http command line tool (such as
curl) - it is easy to write custom exporters
- exporter agent can collect data local on the BIND 9 server
(
named.stats) or via network (statistics channel)
All content © 2021 Internet Systems Consortium, Inc.
Prometheus architecture
- Central Prometheus server collects the data from all agents and stored the data into a time series database
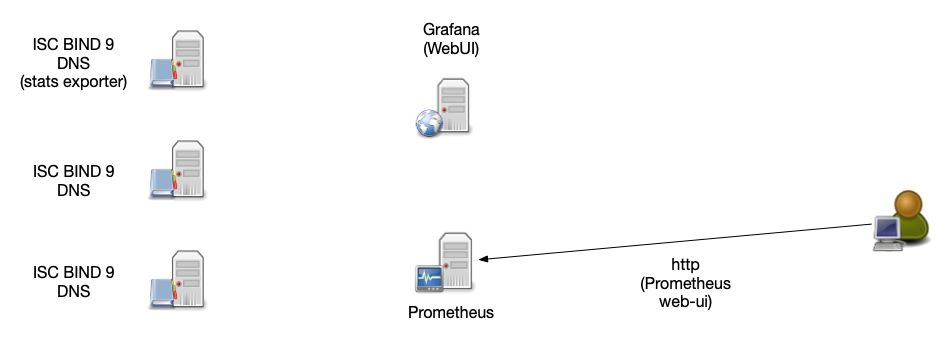
- Data can be queried over a web interface
- Visualization via Prometheus Expression Browser (simple) or Grafana (elaborate)
All content © 2021 Internet Systems Consortium, Inc.
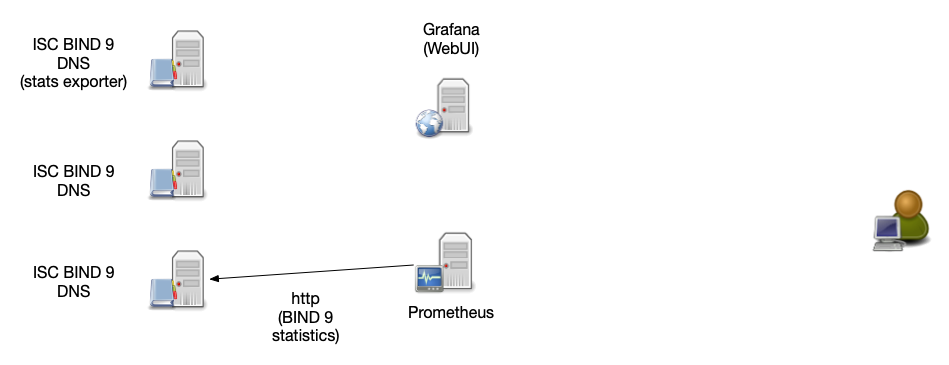
Prometheus architecture
All content © 2021 Internet Systems Consortium, Inc.
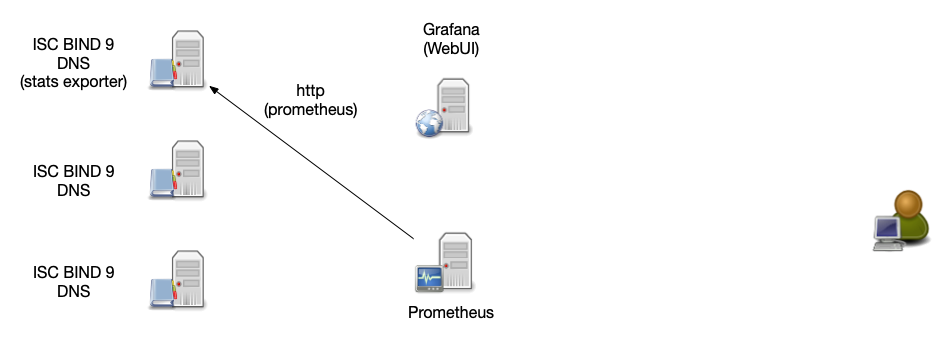
Prometheus architecture
All content © 2021 Internet Systems Consortium, Inc.
Prometheus architecture
All content © 2021 Internet Systems Consortium, Inc.
Prometheus architecture
All content © 2021 Internet Systems Consortium, Inc.
Prometheus exporter for DNS
- BIND 9 stats exporter (
named.stats): https://github.com/qiangmzsx/bind_stats_exporter - BIND 9 statistics exporter from ISC (as part of Stork) https://cloudsmith.io/~isc/repos/stork/groups/
- BIND 9 statistics exporter (statistics channel): https://github.com/prometheus-community/bind_exporter
- DNS latency monitor exporter: https://github.com/openshift/managed-prometheus-exporter-dns
- DNSSEC signature validity and expiration monitor exporter: https://github.com/chrj/prometheus-dnssec-exporter
- DNS Record TTL monitor exporter: https://github.com/bencord0/dnsrecordttl_exporter
- Node DNS exporter (monitors the DNS configuration on a DNS client/cloud instance): https://github.com/evry-ace/node-dns-exporter
- DNS Lookup test exporter: https://github.com/kobtea/dns_lookup_exporter
All content © 2021 Internet Systems Consortium, Inc.
Using open source tools to search and analyze logs
All content © 2021 Internet Systems Consortium, Inc.
The ELK Stack
- ELK is a popular solution for an centralized log management. ELK
combines the open source tools
- Elastic Search https://www.elastic.co/elasticsearch/
- Logstash https://www.elastic.co/logstash
- Kibana https://www.elastic.co/kibana
- Kibana can be replaced with Grafana https://grafana.com/docs/grafana/latest/datasources/elasticsearch/
All content © 2021 Internet Systems Consortium, Inc.
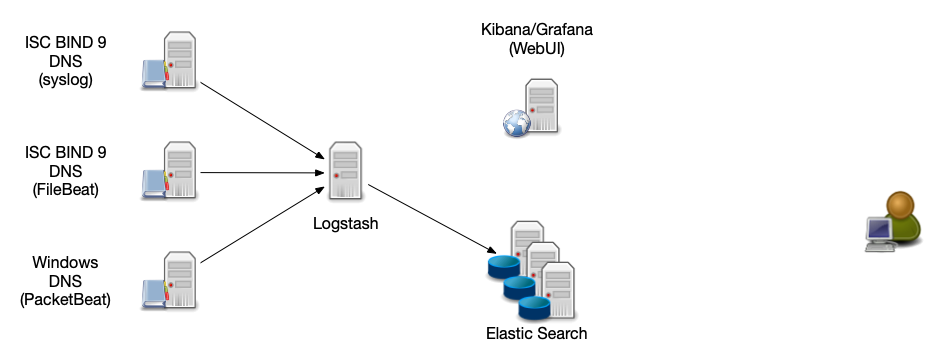
Logstash
- Logstash collects log data from various sources and formats
- Logstash can normalize and filter the data
- After transformation, Logstash stores the data in a central
database (usually into Elastic-Search)
- other outputs are possible, like Syslog, file, MongoDB, StatsD, Network-Monitoring …)
All content © 2021 Internet Systems Consortium, Inc.
Elastic-Search
- Elastic-Search is a distributed search and analysis engine
- Elastic-Search can work with large amounts of data
- Elastic-Search provides log-analysis, monitoring, anomaly-detection and SIEM capabilities (Security information and event management)
All content © 2021 Internet Systems Consortium, Inc.
Kibana / Grafana
- Kibana / Grafana visualize the data stored in Elastic Search
- Query the log-data
- Interactive "drill down" into the dataset
- Graphical trend analysis
- Uptime monitoring
All content © 2021 Internet Systems Consortium, Inc.
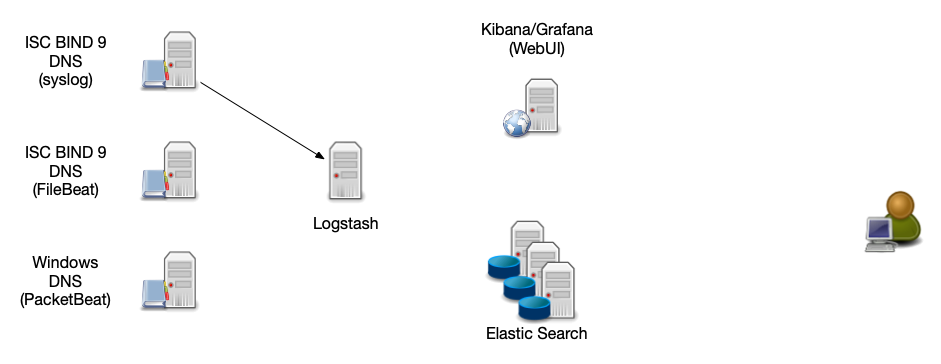
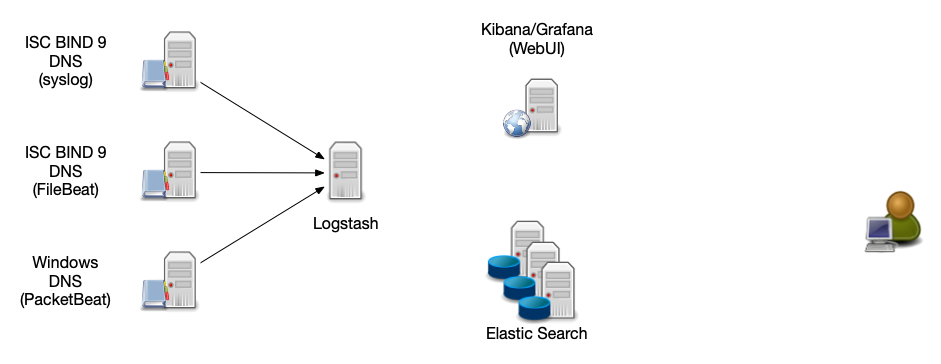
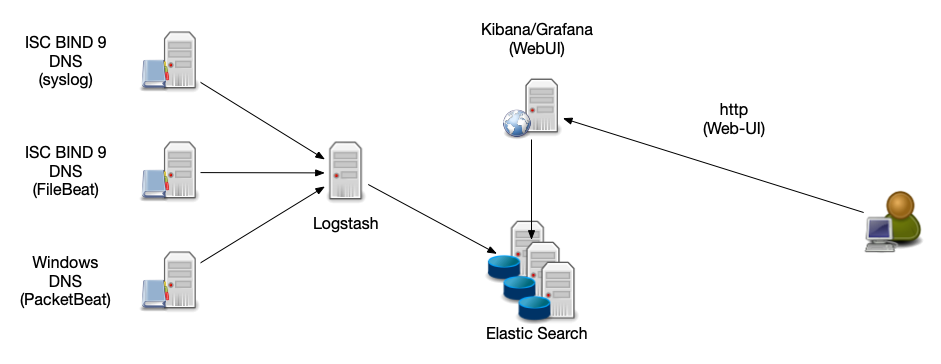
ELK Stack Architecture
All content © 2021 Internet Systems Consortium, Inc.
ELK Stack Architecture

All content © 2021 Internet Systems Consortium, Inc.
ELK Stack Architecture
All content © 2021 Internet Systems Consortium, Inc.
ELK Stack Architecture
All content © 2021 Internet Systems Consortium, Inc.
ELK Stack Architecture
All content © 2021 Internet Systems Consortium, Inc.
Log-Stash Data Sources
- Syslog - the DNS server sends the log information via syslog protocol to the Logstash server
- FileBeat (https://www.elastic.co/beats/filebeat) - An agent on the DNS server reads the log file and forwards the data to the Logstash-Server
- PacketBeat (https://www.elastic.co/beats/packetbeat) reads data directly from the network (pcap) and send it as structured log to Logstash
All content © 2021 Internet Systems Consortium, Inc.
Kibana Visualization - DNS Server Load

All content © 2021 Internet Systems Consortium, Inc.
Kibana Visualization - DNS Query Types

All content © 2021 Internet Systems Consortium, Inc.
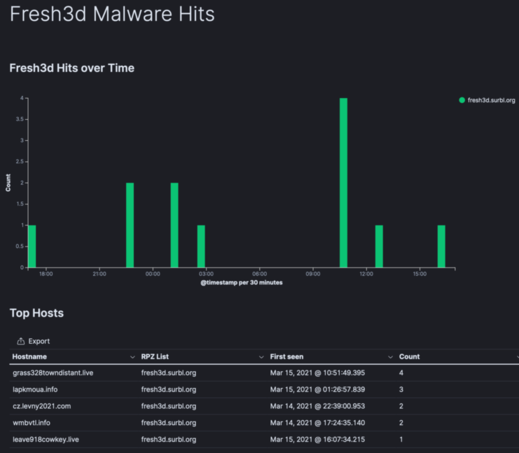
Kibana Visualization - Malware RPZ Hits
All content © 2021 Internet Systems Consortium, Inc.
BIND 9 logs and remote syslog best practice
All content © 2021 Internet Systems Consortium, Inc.
Central Log Server
- A central log server helps correlating log events and central log analysis
- Log data can be transferred via syslog (push) or Systemd-Journal (push or pull)
- Use TLS transport security for sending log data over untrusted networks
- Central server should store the data in a structured way
- Database (SQL or noSQL)
- for large amounts of log data, the central server might be a cluster of multiple machines
All content © 2021 Internet Systems Consortium, Inc.
Plan you logging
- estimate the number of events per seconds
- plan for the worst case (DDoS attack)
- Estimate the size of log messages that need to be stored (~ 100-150 Byte per message)
- Estimate the load
- Can your network sustain the data rate?
- Does this log collection will have an performance (CPU, Network, RAM) impact on the BIND 9 DNS server?
- Can the central server process the data fast enough (normalization, structured data)
- Can the storage keep up with the data rate (Careful with central log servers on virtual machines)?
All content © 2021 Internet Systems Consortium, Inc.
Plan you logging
- How long will a typical query into the data take (seconds, minutes, hours)
- How good does the central log analysis / database scale (over multiple CPU, NUMA Architectures, multiple machines)?
- How will the log data be secured (GDPR)?
- Encryption on storage
- Encryption on transport
- User authentication
- Log-Source authentication
- The log-server needs monitoring, too
All content © 2021 Internet Systems Consortium, Inc.
Normalize log data before sending/storing
- Unfortunately, most Syslog and BIND 9 log data is unstructured
- Modern logging systems (rsyslog, systemd-journal) can convert the unstructured syslog data into structured data
- Structured data is more easy to filter and search
- If possible, structure the data already at the source (to help with filtering, see next slide)
- Send log data in the newer structured RFC 5424 format https://tools.ietf.org/html/rfc5424
- Log normalization for different formats (mmnormalize) https://www.rsyslog.com/log-normalization-for-different-formats/
All content © 2021 Internet Systems Consortium, Inc.
Filter before sending
- Some BIND 9 categories can be very "chatty"
- during an attack (DDoS), the log data can overload a logging server (or the network, adding to the performance pain)
- Try to filter irrelevant information from the logs at the source
(see "Artificial Ignorance" from the beginning)
- forward the filtered and aggregated information to a central server
- You don't want to have 1 mil. lines of the same DNS error, you want to know that this error happen 1 mil. times in a time frame
All content © 2021 Internet Systems Consortium, Inc.
Local buffering
- Some syslog server implementations support local buffering
- They write the log data to local storage in case the network or the remote log server cannot keep up with the amount of data
- Plan for enough local "buffer" storage space
- Make sure the local "buffer" cannot fill the local storage (dedicated log buffer partition)
- Reliable Forwarding of syslog Messages with Rsyslog
All content © 2021 Internet Systems Consortium, Inc.
Log-Server security
- DNS data can contain sensitive information
- IP addresses
- personalized domain names (using URLs with personalized labels on wildcard domain names)
- If the log data passes untrusted networks (the Internet), encrypt the data and authenticate the log server with TLS (Encrypting Syslog Traffic with TLS
All content © 2021 Internet Systems Consortium, Inc.
Log-Server security
- don't store large amounts of log data on DNS servers exposed to the Internet - forward the log data towards an internal, secured system
- Restrict access to log information (authentication)
- Keep access logs
- Delete old log data (raw data), keep aggregated data and outliers
All content © 2021 Internet Systems Consortium, Inc.
Log-Server security
- For security sensitive data, apply cryptographic signatures to
the log messages to be able to detect tampering
- Systemd-Journald "Forward Secure Sealing" (see part 1 of our webinar series)
- RSyslog "Keyless Signature Infrastructure" (KSI) https://de.slideshare.net/rainergerhards1/rsyslog-vs-systemd-journal-presentation
All content © 2021 Internet Systems Consortium, Inc.
The human factor
- You can condense and aggregate the log information …
- … but in the end, it has to be humans that need to check and react on the log data
nobody can replace a good analyst with a perl script (Marcus J. Ranum)
All content © 2021 Internet Systems Consortium, Inc.
Best practices for metrics to monitor for authoritative and recursive
All content © 2021 Internet Systems Consortium, Inc.
Metrics for recursive DNS server (DNS resolver)
- Memory consumption of the BIND 9 process (Cache Memory / Memory fragmentation)
- CPU load (load per CPU core)
- Network card utilization
- Number of clients per time unit
- Number of concurrent clients over UDP
- Number of concurrent clients over TCP
- Rate of incoming TCP queries vs. UDP queries (Clients to resolver)
- Rate of outgoing TCP queries vs. UDP queries (Resolver to authoritative server)
All content © 2021 Internet Systems Consortium, Inc.
Metrics for recursive DNS server (DNS resolver)
- Number of outgoing SERVFAIL responses (indicator for DNSSEC validation issues or a server issue)
- Latency of DNS answers from outside authoritative server (generic, and from a set of "well known" important domains like google.com, facebook.com etc)
- Rate of FORMERR responses towards clients (indicator for network issues, failing CPE updates, malware infected clients)
All content © 2021 Internet Systems Consortium, Inc.
Metrics for authoritative BIND 9 DNS Server
- Number of queries per time unit (load)
- Number of UDP and TCP queries
- Size of DNS answers (-> EDNS0 / Fragmentation)
- Percentage of truncated answers
- NXDOMAIN answers per time unit (indicator for issues with the zone content or DDoS attacks -> random subdomain attack)
- SERVFAIL answers per time unit (indicator for server mis-configuration or DNSSEC issues)
All content © 2021 Internet Systems Consortium, Inc.
Metrics for authoritative BIND 9 DNS Server
- Network card utilization
- CPU utilization (DNSSEC + NSEC3)
- Zone-Transfer per time unit / Errors with Zone-Transfer
- Response-Rate Limiting per client IP
- DNSSEC signing (and automated key rollover) events and errors
- SOA serial numbers on primary/secondary zones, zone update latency
- for dynamic zones: update per time unit
All content © 2021 Internet Systems Consortium, Inc.
Additional Information
- Example session using Log-Templater: https://webinar.defaultroutes.de/webinar/log-templater.html
- Example session using NBS: https://webinar.defaultroutes.de/webinar/nbs.html
- Information and Screenshots about BIND 9 Log-Analysis with ELK provided by NetCon Unternehmensberatung GmbH https://www.netcon-consulting.com
All content © 2021 Internet Systems Consortium, Inc.
Upcoming Webinars
- April 21: Session 3. Load balancing with DNSdist
- May 19: Session 4. Dynamic zones, pt1 - Basics
- June 16: Session 5. Dynamic zones, pt2 - Advanced topics
All content © 2021 Internet Systems Consortium, Inc.
Questions and Answers
All content © 2021 Internet Systems Consortium, Inc.