
BIND 9
(Part 1 - Event based BIND 9 log- and system analysis)
Carsten Strotmann and the ISC Team
Created: 2021-02-17 Wed 18:40
All content © 2021 Internet Systems Consortium, Inc.
Welcome
Welcome to part one of our BIND 9 webinar series
All content © 2021 Internet Systems Consortium, Inc.
In this Webinar
- best practice BIND 9 log template for authoritative server
- best practice BIND 9 log template for DNS resolver
- file system best practices for BIND 9 log files, transparent online compression
- searching through log-files with modern 'grep': ugrep, ripgrep, sack, sift …
- BIND 9 Log-Analysis with Linux Systemd-Journal
- Identifying hot-spots in BIND 9 logfiles with histograms
- Condensing information from large BIND 9 logfiles with the "logeater" tools
- Monitoring BIND 9 run-time information with
atop - Incident based DNSTAP and TCPDUMP traffic capture
All content © 2021 Internet Systems Consortium, Inc.
BIND 9 logging
All content © 2021 Internet Systems Consortium, Inc.
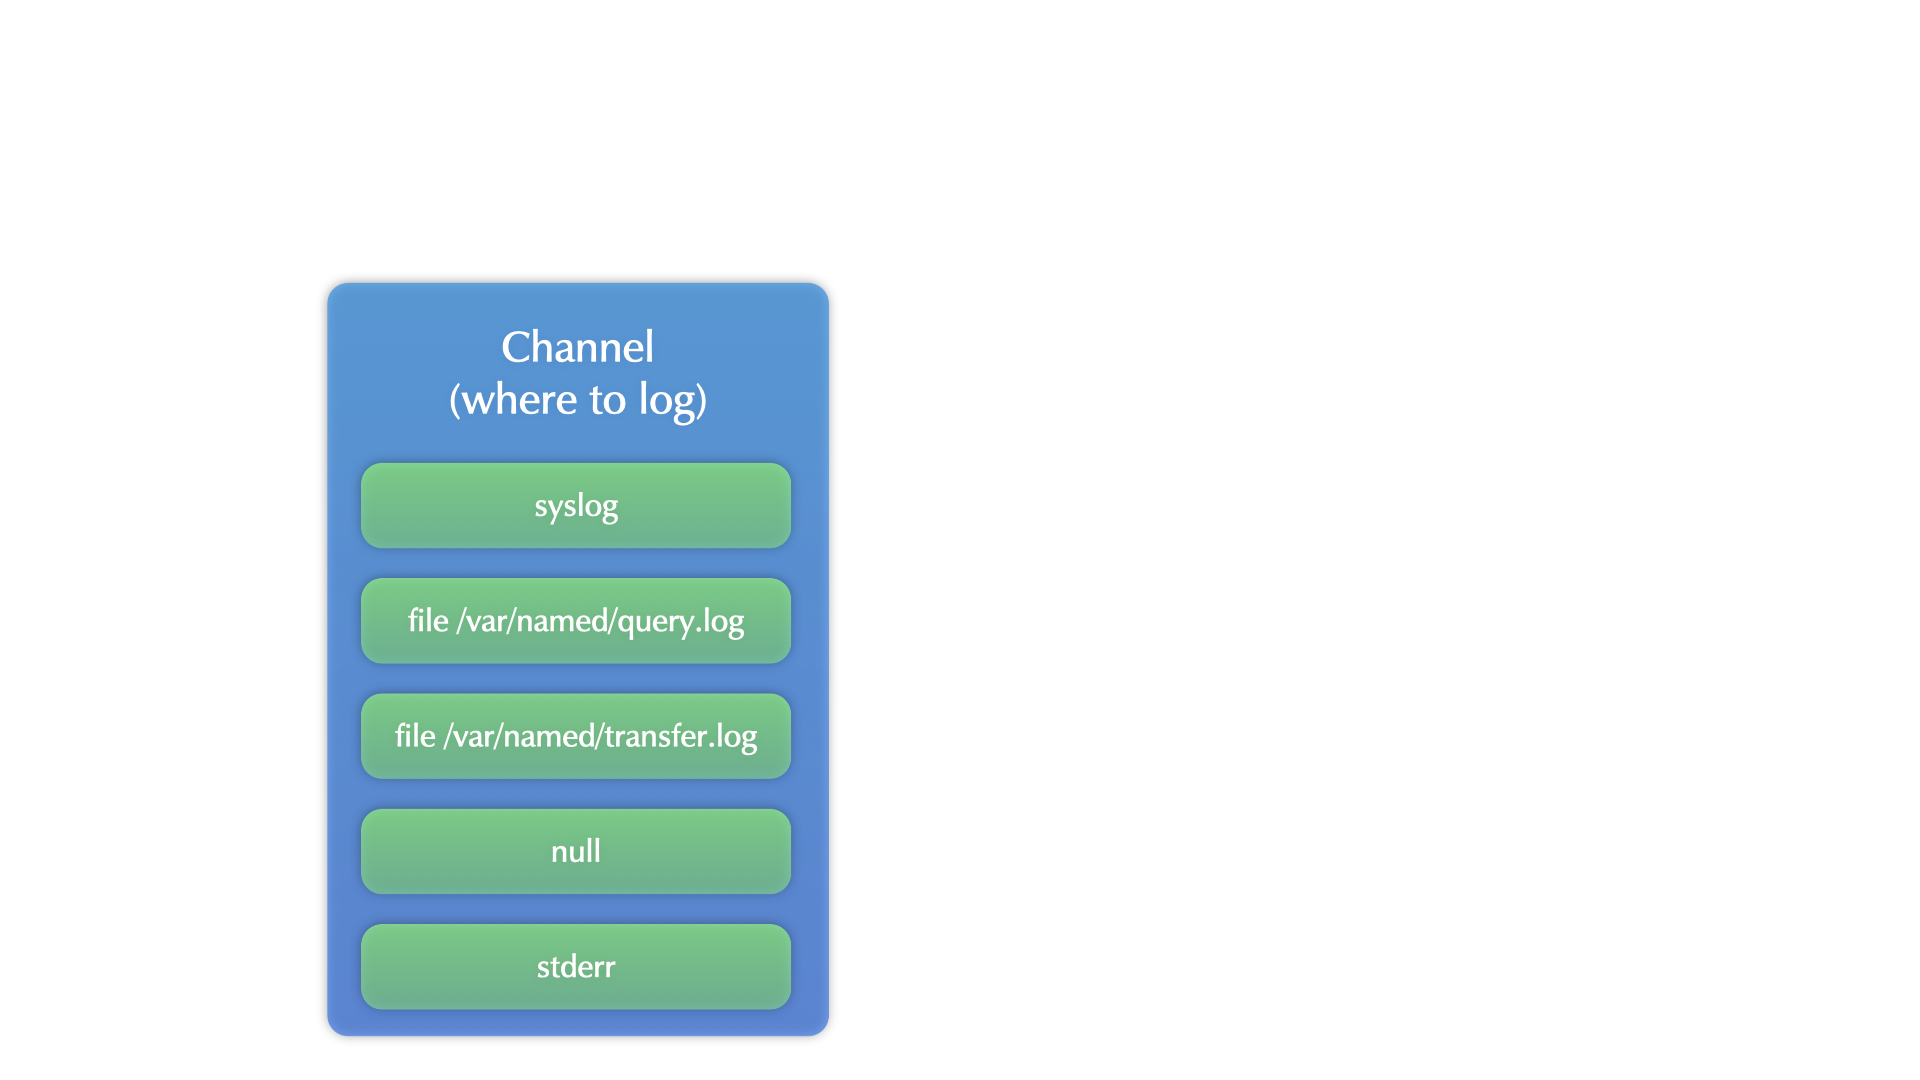
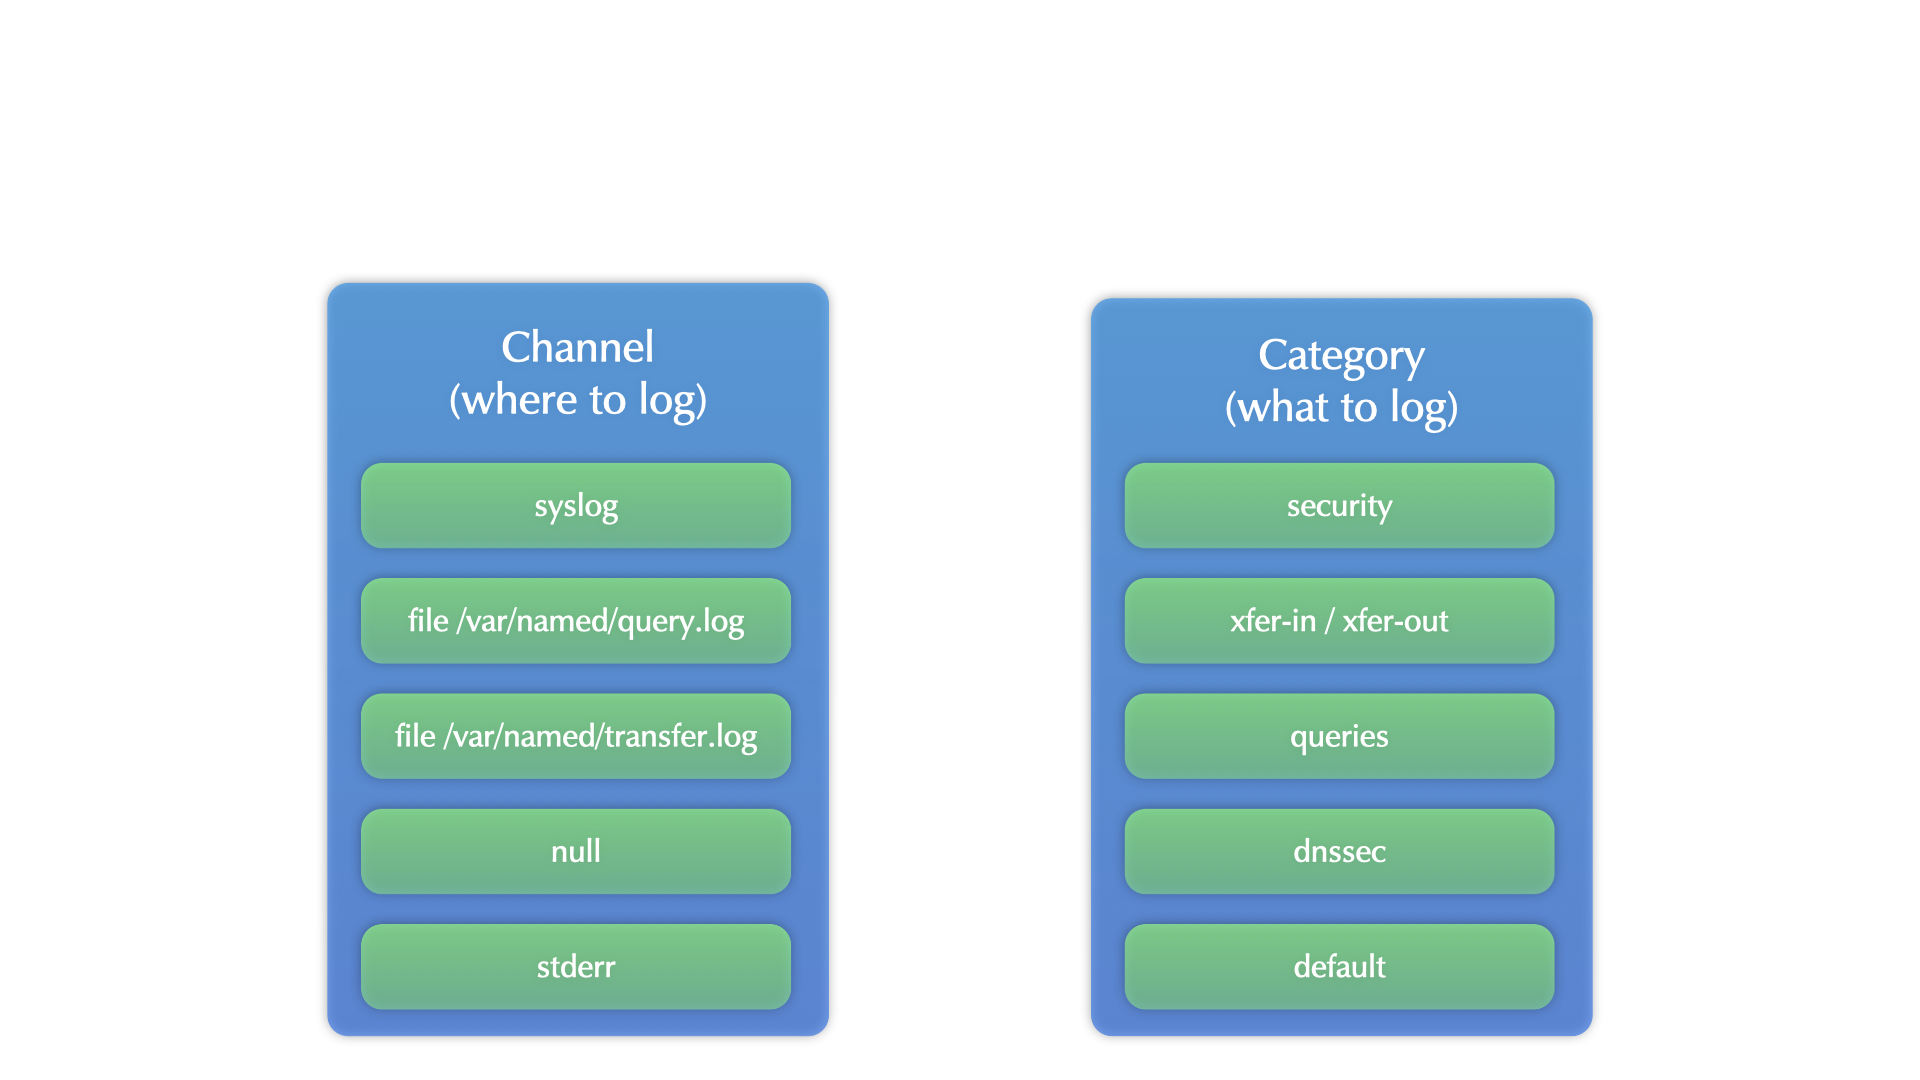
BIND 9 logging
- BIND 9 has one of the most flexible logging framework found in Unix/Linux server products
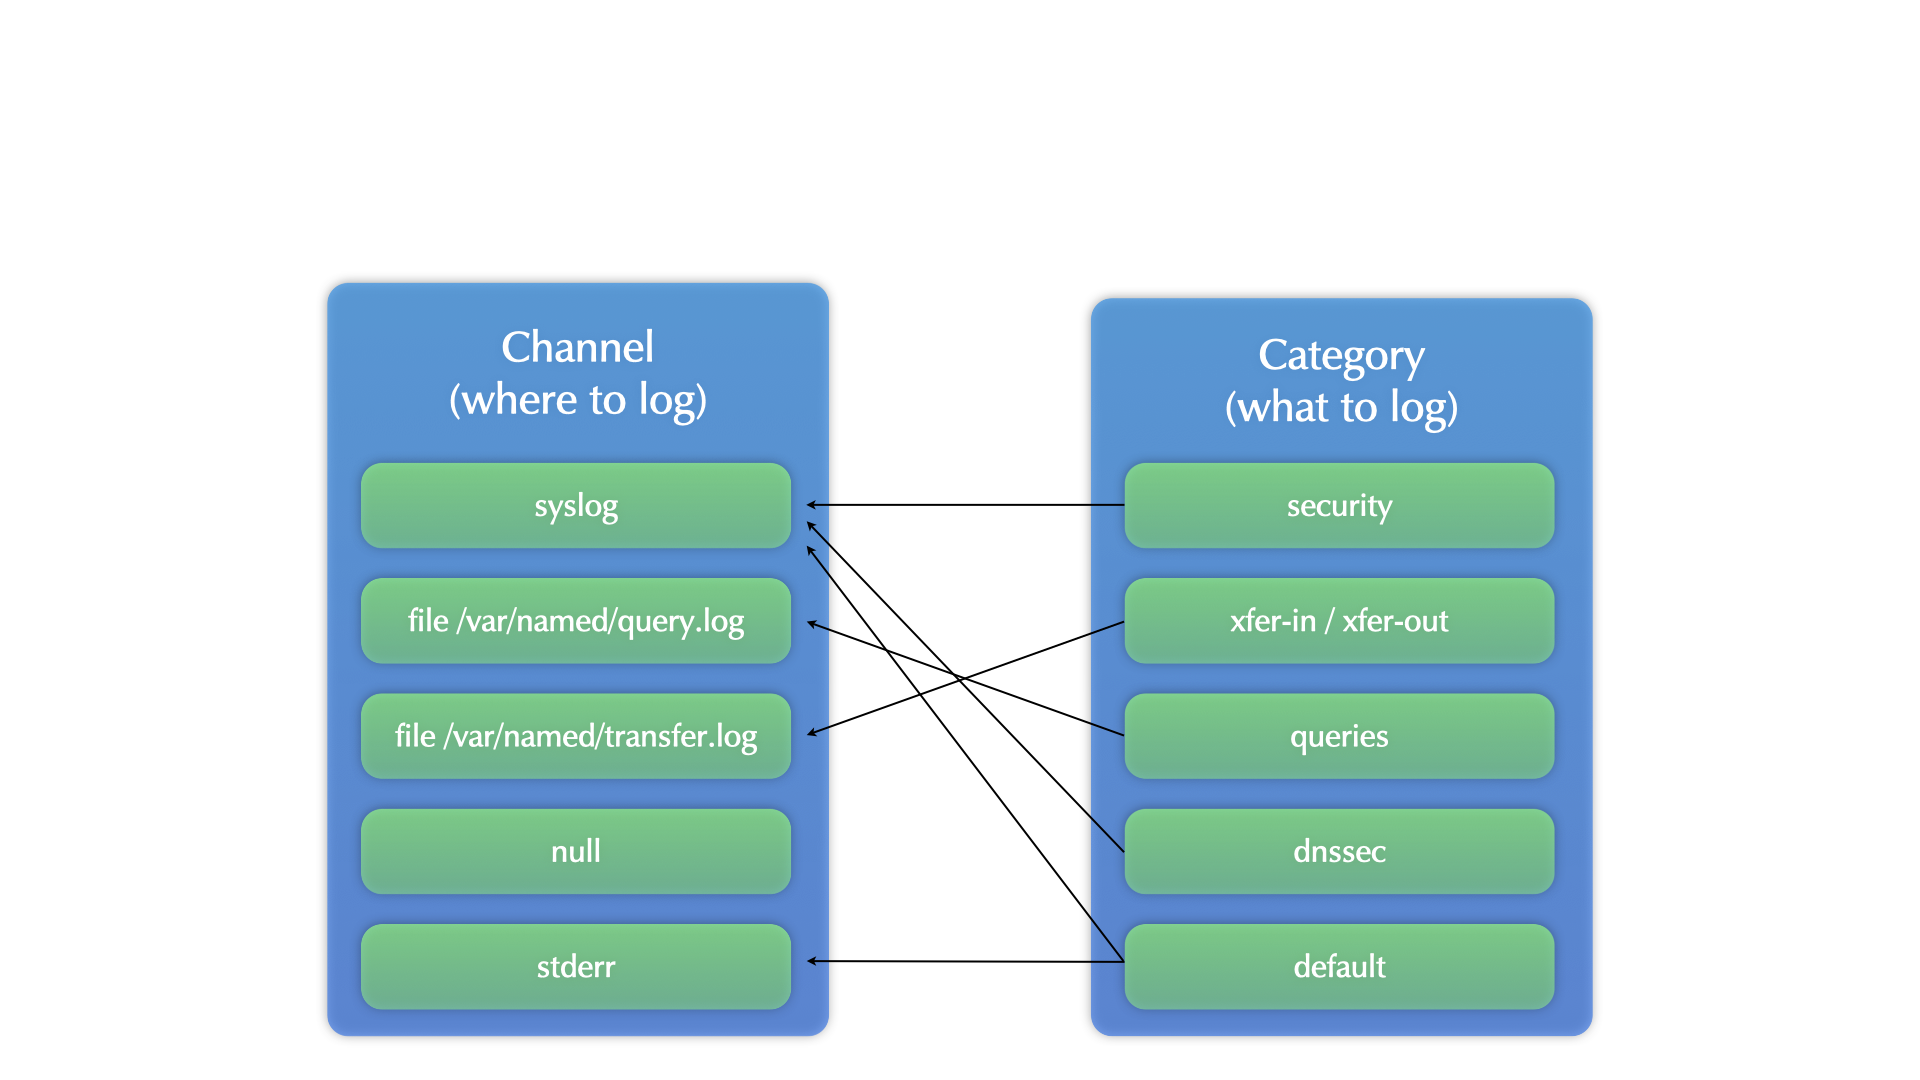
categoriesdefine what should be written to the logschanneldefine where the log data should be written- multiple
categoriescan be written into the same channel - one
categorycan be written to multiple channels
All content © 2021 Internet Systems Consortium, Inc.
BIND 9 logging

All content © 2021 Internet Systems Consortium, Inc.
BIND 9 logging
All content © 2021 Internet Systems Consortium, Inc.
BIND 9 logging
All content © 2021 Internet Systems Consortium, Inc.
BIND 9 logging
All content © 2021 Internet Systems Consortium, Inc.
Logging configuration
- separate log categories with many entries per day from categories
with only a few entries a day
- else it will be hard to spot the few entries and react on them
- combine categories with related information into the same channel
- for example:
xfer-in,xfer-out,notifyorupdateandupdate-security - use the logging configuration statement
print-category yes;to be able to filter for the categories in combined log files
- for example:
All content © 2021 Internet Systems Consortium, Inc.
Logging severity
- BIND 9 supports the syslog priorities (debug, info, warning,
error …) also when writing to a log-file
- a lower priority for a channel will include all messages of the selected priority/severity and higher
- Using the logging statement
print-severity yes;BIND 9 will print the logging severity in the log file- this allows for later filtering of the log file based on the severity
2021-02-17T11:27:36.593 general: info: reloading configuration succeeded
2021-02-17T11:27:36.600 general: info: reloading zones succeeded
2021-02-17T11:27:37.006 general: notice: all zones loaded
2021-02-17T11:27:37.100 general: notice: running
2021-02-17T11:27:43.929 query-errors: info: client @0x5dbab4d4 ::1#63099 (fail05.dnssec.works): query failed (zone not loaded) for fail05.dnssec.works/IN/SOA at query.c:5448
2021-02-17T11:27:49.962 query-errors: info: client @0x5dbab4d4 ::1#59273 (fail05.dnssec.works): query failed (zone not loaded) for fail05.dnssec.works/IN/SOA at query.c:5448
2021-02-17T11:27:50.073 general: info: zone fail05.dnssec.works/IN: refresh: unexpected rcode (SERVFAIL) from master ::1#53 (source ::#0)
All content © 2021 Internet Systems Consortium, Inc.
RPZ Logging
- The RPZ logging category gives information about the response policy zone activity on the server:
17-Feb-2021 11:56:55.311 client @0x7f4fb5f3cd40 2001:db8:ff:1a00:95e8:d30:c8a9:6ced#62678 (31b4bd31fg1x2.virus): rpz QNAME PASSTHRU rewrite 31b4bd31fg1x2.virus via 31b4bd31fg1x2.virus.rpz.zone
17-Feb-2021 11:57:24.663 client @0x7f4fcd2379b0 2001:db8:561:5:7935:d587:336b:436e#17126 (malware.com): rpz QNAME PASSTHRU rewrite malware.com via malware.com.malware.rpz.zone
17-Feb-2021 11:57:24.840 client @0x7f4fc5a66560 2001:db8:4212:0:11da:b4a5:b77e:31dc#45577 (trojan.biz): rpz QNAME PASSTHRU rewrite trojan.biz via trojan.biz.tojan.rpz.zone
17-Feb-2021 11:57:41.814 client @0x7f4f51668910 1002:db8:1121:5:7935:d587:336b:436e#4460 (badstuff.com): rpz QNAME PASSTHRU rewrite badstuff.com via badstuff.com.rpz.zone
All content © 2021 Internet Systems Consortium, Inc.
Logging configuration template
- Please find a logging configuration template for BIND 9.16 in this document linked below:
All content © 2021 Internet Systems Consortium, Inc.
Query-Logging
- The BIND 9 log system allows to write a log entry for every incoming query
- the log entries will list the IP address of the sender, the domain name of the query, the record type and information on the flags (DNSSEC OK, EDNS, Recursion Desired etc) of the query sender
2021-01-18T15:13:01.438 client @0x413ce4d4 192.0.2.4#13700 (blog.defaultroutes.de): \
                        query: blog.defaultroutes.de IN AAAA - (5.45.109.212)
All content © 2021 Internet Systems Consortium, Inc.
Performance issues with query logging
- Converting the query log information from binary data into human
readable text format is CPU intensive
- enabling query logging on an busy DNS server (> 500 Queries/Second) can reduce the performance of the DNS server and increase the latency of DNS answers
- Query-Logging should be disabled on (re-)start of the BIND 9 process and should only be enabled for a short period of time during troubleshooting:
options {
        directory "/var/named";
        querylog no;
        [...]
};
All content © 2021 Internet Systems Consortium, Inc.
Alternatives to BIND 9 query logging
- BIND 9 query logging only gives information on the query, but not on the answer send out
- alternatives to query logging exist that capture queries and
responses and have less impact on the DNS servers performance:
- DNSTAP: Using DNSTAP with BIND https://kb.isc.org/docs/aa-01342
- PCAP/tcpdump based passive DNS data collection: for example DNSmezzo from AFNIC https://github.com/AFNIC/DNSwitness
All content © 2021 Internet Systems Consortium, Inc.
File-System and logging best practices
All content © 2021 Internet Systems Consortium, Inc.
Partitions
- Modern Unix and Linux systems sometimes propose a single partition install
- While this is usually good for Desktop/Laptop installs, it increases the risk of the operating system (root) partition running full
- Bad things will happen once the root partition runs out of storage space
- Recommendation: create a dedicated (large enough) partition for
the log files (mount to
/var/logor the place where your BIND 9 server writes the log files)
All content © 2021 Internet Systems Consortium, Inc.
Log-file compression
- Tools like
logrotatecan compress logfiles to save space- However, disk space is seldom a problem today
- Working with compressed log files is more difficult then with plain text files
- Some file systems (BTRFS, ZFS) offer transparent
onlinecompression which can speed up I/O performance of logfile operations
All content © 2021 Internet Systems Consortium, Inc.
Logging with Linux systemd-journald
All content © 2021 Internet Systems Consortium, Inc.
Systemd Journal
- Modern Linux systems come with the systemd process management
system
- systemd includes a database of log information called the journal
- the Systemd-Journal can be stored locally (on the same machine the service runs) or remote (on a central Journal-Server)
All content © 2021 Internet Systems Consortium, Inc.
Benefits of the systemd journal
- Automatically correlates log entries from different sources (systemd process start up, network stack, BIND 9 server)
- Allows easy filtering of log information by time, service, keyword
- Output log entries as text (different flavors), JSON or binary
- On a central journal host, can merge log information from multiple hosts
- Can log remotely via push or pull configurations
- Support online compression
- Supports Forward Secure Sealing to detect tampering with written log data
All content © 2021 Internet Systems Consortium, Inc.
Using the Systemd Journal with BIND 9
- BIND 9 needs to be started from a systemd service unit
- Systemd will capture all information written to the
stdoutandstderrchannels of the BIND 9 process and store that information into the Journal- in the BIND 9 logging configuration, you need to configure the
relevant log information to be send to
stdoutorstderr
- in the BIND 9 logging configuration, you need to configure the
relevant log information to be send to
All content © 2021 Internet Systems Consortium, Inc.
Live Demo Systemd-Journal
All content © 2021 Internet Systems Consortium, Inc.
Searching/filtering of logfiles
All content © 2021 Internet Systems Consortium, Inc.
Modern Tools
- Traditional tools to search and filter through log-files are
grep,awkandperl - A few years ago, a number of new tools appeared that have
pros compared with the traditional tools:
- Multi-CPU core scalability
- Faster regular expression engines
- Interactive filter capabilities
- Work transparently on compressed files
All content © 2021 Internet Systems Consortium, Inc.
Modern "grep" alternatives
- Sack - https://github.com/sampson-chen/sack
- uGrep - https://github.com/Genivia/ugrep
- RipGrep - https://github.com/BurntSushi/ripgrep
- sift - https://sift-tool.org/
All content © 2021 Internet Systems Consortium, Inc.
Live Demo - ugrep
All content © 2021 Internet Systems Consortium, Inc.
Condensing information from large logfiles
All content © 2021 Internet Systems Consortium, Inc.
Logeater
- from time to time I'm tasked with finding the root cause of an BIND 9 incident in large (> 1 GB) BIND 9 logfiles
- I've written the logeater tools to help with that task
- The source code (golang) can be found at https://github.com/cstrotm/logeater
- be careful: the logeater tools distribute the work on all available CPU cores, don't run the tools on a productions DNS server, the tools can starve the DNS server process
All content © 2021 Internet Systems Consortium, Inc.
Logeater-queries
- logeater-queries will read a BIND 9 (9.10+) style query log file and will output statistics and aggregated information from the file:
$ ./logeater-queries -h
Usage of ./logeater-queries:
  -c	list query network classes
  -d	list domain names
  -i	list query IP addresses
  -n	no reverse IP lookup
  -s	list statistics
  -t	list query type
All content © 2021 Internet Systems Consortium, Inc.
Example use of logeater-queries
- logeater-queries Example - printing network classes and query types of queries:
$ cat query.log | ./logeater-queries -c -t | column -t

Query-Network-Classes
21379                  :  IN
6                      :  CH

Query-Network-Types
8514                   :  A
4060                   :  AAAA
3079                   :  SOA
2372                   :  DNSKEY
927                    :  PTR
658                    :  MX
543                    :  NS
312                    :  DS
286                    :  TXT
186                    :  NSEC
129                    :  ANY
115                    :  CNAME
[…]
All content © 2021 Internet Systems Consortium, Inc.
Example use of logeater-queries
logeater-queriesExample - printing the top ten query IP addresses with reverse name resolution:
$ cat query.log | ./logeater-queries -i | head | column -t
Query-IP-Addresses
1571                :  212.114.206.217                   [muc.example.de.]
821                 :  2620:74:13:4400::41               [dnsviz-db.verisignlabs.com.]
794                 :  72.13.58.112                      [dnsviz-db.verisignlabs.com.]
704                 :  54.234.42.241                     [241.compute-1.amazonaws.com.]
682                 :  2001:19f0:5001:df:76d7:5703:ba0a:e220  []
565                 :  185.92.221.212                    [185.92.221.212.vultr.com.]
467                 :  185.22.143.29                     [b9168f1d.cgn.dg-w.de.]
314                 :  91.51.184.46                      [3b82e.dip0.t-ipconnect.de.]
All content © 2021 Internet Systems Consortium, Inc.
Logeater-DNSSEC
logeater-dnssecanalyses the a log file with messages from the DNSSEC category and groups the error messages :
$ cat dnssec.log | ./logeater-dnssec | head
8727 : 0C9F6LGOE6NADAS8KG1CLIK9UO9G7EIG.ad/NSEC3: no valid signature found
6953 : ad/SOA: no valid signature found
3976 : sat-tv.com/A: got insecure response; parent indicates it should be secure
1730 : mozilla.com/SOA: no valid signature found
1586 : stream.bestvideostreaming.is/A: no valid signature found
1577 : 8FC1DQ3C2Q3ERFD4UO40ENDBTSFME5JO5.ad/NSEC3: no valid signature found
1576 : sat-tv.com/SOA: got insecure response; parent indicates it should be secure
1576 : cdws.eu-west-1.amazonaws.com.Cisco/AAAA: bad cache hit (amazonaws.com.Cisco/DS)
1483 : 0c9f6lgoe6n13ad9iu1clik9uo9g7eig.ad/NSEC3: no valid signature found
968 : cbr.de/NSEC: no valid signature found
All content © 2021 Internet Systems Consortium, Inc.
Logeater-Resolver
logeater-resolveranalyses the a log file with messages from the resolver category and groups the error messages :
$ cat resolvers.log | ./logeater-resolvers | head
42908 : s-cnc1.qq.com/AAAA: Name qq.com (SOA) not subdomain of zone ns-cnc1.qq.com -- invalid response
42713 : s-tel1.qq.com/AAAA: Name qq.com (SOA) not subdomain of zone ns-tel1.qq.com -- invalid response
42484 : s-os1.qq.com/AAAA: Name qq.com (SOA) not subdomain of zone ns-os1.qq.com -- invalid response
42297 : s-cmn1.qq.com/AAAA: Name qq.com (SOA) not subdomain of zone ns-cmn1.qq.com -- invalid response
20346 : mails.sonymusicfans.com/DS: invalid response
10920 : tp1.glb.nist.gov/DS: invalid response
9693 : media.netd.com.tr/AAAA for client 192.0.2.165#3347: Name netd.com.tr (SOA) not subdomain of zone media.netd.com.tr -- invalid response
7932 : service.superc.net/AAAA for client 192.0.2.11#3073: Name superc.net (SOA) not subdomain of zone service.superc.net — invalid response
4597 : brickleonavon.com/NS for client 192.0.2.46#3073: Name . (SOA) not subdomain of zone brickleonavon.com -- invalid response
4474 : promo.mobile.de/AAAA for client 2001:db8:1800:88:78f9:ba4:45fe:d438#48296: Name mobile.de (SOA) not subdomain of zone promo.mobile.de -- invalid response
All content © 2021 Internet Systems Consortium, Inc.
Live-Demo Logeater Tools
All content © 2021 Internet Systems Consortium, Inc.
Logfile histograms
All content © 2021 Internet Systems Consortium, Inc.
Finding hot-spots or outliers
- When working with large BIND 9 log files (or
tcpdumppcap files), I often generate histograms over the logfiles to find hot-spots or outliers - Logfile Histograms can be created from any field in the logfile
- Time based
- Query name based
- Query IP address based
- Error message based
- Histogram creation is done with classic Unix tools in a shell pipeline
All content © 2021 Internet Systems Consortium, Inc.
Time based histogram
- Example of a time based histogram from BIND 9 log files with DNSSEC issues
cat dnssec.log | grep "2021-02-17" | awk '{print substr($0,0,16)}' \
 | uniq -c | awk '{printf("\n%s ",$0) ; for (i = 0; i<$1/100 ; i++) \
 {printf("*")};}' | less
All content © 2021 Internet Systems Consortium, Inc.
Time based histogram output
- This histogram shows an incident around 18:17 UTC on 27th April 2020:
 178 27-Apr-2020 18:09 **
 159 27-Apr-2020 18:10 **
 160 27-Apr-2020 18:11 **
 169 27-Apr-2020 18:12 **
 175 27-Apr-2020 18:13 **
 166 27-Apr-2020 18:14 **
 183 27-Apr-2020 18:15 **
 224 27-Apr-2020 18:16 ***
4082 27-Apr-2020 18:17 *****************************************
4439 27-Apr-2020 18:18 *********************************************
3476 27-Apr-2020 18:19 ***********************************
3212 27-Apr-2020 18:20 *********************************
2484 27-Apr-2020 18:21 *************************
2201 27-Apr-2020 18:22 ***********************
2036 27-Apr-2020 18:23 *********************
2032 27-Apr-2020 18:24 *********************
2059 27-Apr-2020 18:25 *********************
1679 27-Apr-2020 18:26 *****************
 943 27-Apr-2020 18:27 **********
 639 27-Apr-2020 18:28 *******
 500 27-Apr-2020 18:29 *****
 414 27-Apr-2020 18:30 *****
All content © 2021 Internet Systems Consortium, Inc.
Example: Histogram by log messages
- This pipeline prints the log messages from
security.logbased on the number of recurring messages
cat security.log | grep "2021-02-14" | awk -F : '{print substr($4,0,60)}' | \
  uniq -c | sort -nr | \
  awk '{printf("\n%s ",$0) ; for (i = 0; i<$1/10 ; i++) {printf("*")};}'
All content © 2021 Internet Systems Consortium, Inc.
Example: Histogram by log messages output
100  query (cache) 'www.google.com/A/IN' denied **********
 10  query (cache) 'peacecorps.gov/ANY/IN' denied *
  2  query (cache) 'com/ANY/IN' denied *
  2  query (cache) '67b.org/AAAA/IN' denied *
  1  query (cache) 'www.qq.com/A/IN' denied *
  1  query (cache) 'www.qq.com/A/IN' denied *
  1  query (cache) 'researchscan541.eecs.umich.edu/A/IN' denied *
  1  query (cache) 'pizzaseo.com/RRSIG/IN' denied *
  1  query (cache) 'invalid.parrotdns.com/A/IN' denied *
  1  query (cache) 'dnsscan.shadowserver.org/A/IN' denied *
  1  query (cache) 'cpsc.gov/ANY/IN' denied *
  1  query (cache) 'c.afekv.com/A/IN' denied *
  1  query (cache) 'amazon.com/A/IN' denied *
  1  query (cache) '5-45-109-212-60287611.spiderprobe.com/A/IN'  *
  1  query (cache) '37-120-183-122-60287611.spiderprobe.com/A/IN *
  1  query (cache) '212.109.45.5.in-addr.arpa/PTR/IN' denied *
  1  query (cache) '122.183.120.37.in-addr.arpa/PTR/IN' denied *
All content © 2021 Internet Systems Consortium, Inc.
System-Monitoring with atop
All content © 2021 Internet Systems Consortium, Inc.
atop - a top alternative of 'steroids'
atopis an real-time system monitor. It is an alternative to the original Unix/Linuxtoptool- Advantages
- Shows resource usage of ALL processes, even those that are closed/completed.
- Monitors threads within processes & ignores processes that are unused.
- Accumulates resource usage for all processes and users with the same name.
- Highlights critical resources using colors (red).
- Will add or remove columns as the size of the display window changes.
- Includes disk I/O and network utilization.
- Shows interrupt utilization per CPU and CPU frequencies
- Uses netatop kernel module to monitor TCP & UDP and network bandwidth.
All content © 2021 Internet Systems Consortium, Inc.
Atop Example
ATOP - dns-resolver-01                      2021/02/15  13:39:41                    --------------                      10s elapsed
PRC | sys    0.45s  | user  61.38s |  #proc    261 |  #trun      5 | #tslpi   299  | #tslpu     0 |  #zombie    0 |  #exit      3 |
CPU | sys     180%  | user    446% |  irq      34% |  idle   1342% | wait      0%  | guest     0% |  curf 1.78GHz |  curscal  54% |
cpu | sys      16%  | user     48% |  irq       0% |  idle     35% | cpu005 w  0%  | guest     0% |  curf 2.42GHz |  curscal  73% |
cpu | sys      16%  | user     48% |  irq       0% |  idle     36% | cpu018 w  0%  | guest     0% |  curf 2.82GHz |  curscal  85% |
cpu | sys      15%  | user     45% |  irq       0% |  idle     40% | cpu007 w  0%  | guest     0% |  curf 1.30GHz |  curscal  39% |
cpu | sys      17%  | user     44% |  irq       0% |  idle     40% | cpu015 w  0%  | guest     0% |  curf 2.26GHz |  curscal  68% |
cpu | sys      15%  | user     37% |  irq       0% |  idle     48% | cpu009 w  0%  | guest     0% |  curf 1.20GHz |  curscal  36% |
cpu | sys      12%  | user     25% |  irq       0% |  idle     62% | cpu003 w  0%  | guest     0% |  curf 1.20GHz |  curscal  36% |
cpu | sys      10%  | user     26% |  irq       1% |  idle     64% | cpu001 w  0%  | guest     0% |  curf 1.20GHz |  curscal  36% |
CPL | avg1    6.60  | avg5    6.22 |  avg15   6.21 |               | csw  1988779  | intr 1440528 |               |  numcpu    20 |
MEM | tot    62.8G  | free   24.4G |  cache  29.3G |  buff    1.0G | slab    1.4G  | shmem   3.1M |  vmbal   0.0M |  hptot   0.0M |
SWP | tot     8.0G  | free    8.0G |               |               |               |              |  vmcom   2.4G |  vmlim  39.4G |
DSK |          sda  | busy      0% |  read       0 |  write    201 | KiB/w     11  | MBr/s    0.0 |  MBw/s    0.2 |  avio 0.00 ms |
NET | transport     | tcpi    1889 |  tcpo    1538 |  udpi  764422 | udpo  768448  | tcpao     66 |  tcppo    250 |  tcprs     15 |
NET | network       | ipi   767687 |  ipo   770138 |  ipfrw      0 | deliv 767685  |              |  icmpi   1372 |  icmpo      6 |
NET | eno49     1%  | pcki  791200 |  pcko  793659 |  sp   10 Gbps | si   75 Mbps  | so  123 Mbps |  erri       0 |  erro       0 |
NET | ens2f3    0%  | pcki      18 |  pcko      28 |  sp 1000 Mbps | si    0 Kbps  | so    7 Kbps |  erri       0 |  erro       0 |
NET | lo      ----  | pcki      20 |  pcko      20 |  sp    0 Mbps | si    1 Kbps  | so    1 Kbps |  erri       0 |  erro       0 |

  PID    SYSCPU    USRCPU     VGROW     RGROW    RUID        EUID        ST    EXC     THR    S    CPUNR     CPU    CMD         1/7
 2992     0.00s    61.37s        0K        0K    named       named       --      -      11    S        9    638%    named
 1140     0.19s     0.00s        0K        0K    root        root        --      -       1    S       13      2%    haveged
16622     0.03s     0.00s     9324K     1240K    user        staff       --      -       1    R        0      0%    atop
    9     0.02s     0.00s        0K        0K    root        root        --      -       1    I       15      0%    rcu_sched
All content © 2021 Internet Systems Consortium, Inc.
Atop background monitoring
atopcan be run as a daemon process in the background- in this example,
atopcollects the system information every 60 seconds into the (binary) file/var/log/atop/atop_20210215(rotated daily)
- in this example,
# systemctl status atop
● atop.service - Atop advanced performance monitor
   Loaded: loaded (/lib/systemd/system/atop.service; enabled; vendor preset: enabled)
   Active: active (running) since Mon 2021-02-15 00:00:02 CET; 13h ago
     Docs: man:atop(1)
 Main PID: 10509 (atop)
    Tasks: 1 (limit: 4915)
   CGroup: /system.slice/atop.service
           └─10509 /usr/bin/atop -R -w /var/log/atop/atop_20210215 60

Feb 15 00:00:02 dns-resolver-12 systemd[1]: Started Atop advanced performance monitor.
All content © 2021 Internet Systems Consortium, Inc.
Replay historical atop data
atopcan read the (binary) historical data- the tools then allows to move back and forth in the time to investigate past system events
atop -r /var/log/atop/atop_20210215
All content © 2021 Internet Systems Consortium, Inc.
Live Demo of atop
All content © 2021 Internet Systems Consortium, Inc.
Incident based traffic capture
All content © 2021 Internet Systems Consortium, Inc.
DNS incidents and available data
- As it is hard to predict when a DNS or network incident will strike, often valuable detail data from the incident is missing
- Next we show an example of a system that measures critical system
parameter (CPU load, UDP and TCP query volume) and will start a
network capture with
tcpdumponce a threshold is reached- can be adapted to do other data collection (DNSTAP, wireshark/tshark, dnscap etc)
- scripts should test the amount of free storage space before starting the data collection
- the scripts should also raise a alarm, so that someone knows there is data to be examined
All content © 2021 Internet Systems Consortium, Inc.
Systemd Timer Unit
- file
/etc/systemd/system/tcpdump-starter.timer: this systemd unit starts thetcpdump-starterservice every 60 seconds after the last termination of the same service
[Unit]
Description=TCPDUMP Starter Timer

[Timer]
OnUnitInactiveSec=60s

[Install]
WantedBy=timers.target
All content © 2021 Internet Systems Consortium, Inc.
Systemd service unit
- the unit file in
/etc/systemd/system/tcpdump-starter.servicestarts thetcpdump-starterscript on the timer event- parameter
-c 12: start collecting detail information when the CPU load is > 12 - parameter
-u 32000: start collecting detail information if the number of queries over UDP > 32.000 - parameter
-t 1000: start collecting detail information if the number of queries over TCP > 1.000
- parameter
[Unit]
Description=TCPDUMP Starter Service

[Service]
Type=oneshot
ExecStart=/usr/local/sbin/tcpdump-starter  -c 12 -u 32000 -t 1000

[Install]
WantedBy=multi-user.target
All content © 2021 Internet Systems Consortium, Inc.
Tcpdump-starter Script (1/4)
- The script sets some default values and processes the parameter to the script
#!/bin/sh
set -o nounset

cputhreshold=12
udpthreshold=32000
tcpthreshold=1000
diskthreshold=10000000
interface=eth0

while getopts ':t:u:c:' optname
do
    case $optname in
        c) cputhreshold=$OPTARG;;
        t) tcpthreshold=$OPTARG;;
        u) udpthreshold=$OPTARG;;
        :)
            echo "$(basename $0): Argument missing for option ${OPTARG}" >&2
            exit 2;;
        \?)
            echo "$(basename $0): Unknown option ${OPTARG}" >&2
            exit 2;;
        *)
            echo "$(basename $0): Internal error, unexpected option ${optname}" >&2
            exit 3;;
    esac
done
shift $((OPTIND-1))
[...]
All content © 2021 Internet Systems Consortium, Inc.
Tcpdump-starter Script (2/4)
- the 2nd part checks the CPU load
[...]
# test for high CPU load
avg=$(cat /proc/loadavg | cut -d '.' -f 1)

if [ $cputhreshold -le $avg ]; then
    echo "High CPU Load ${cputhreshold}"
    logger -t tcpdump "High CPU Load ${avg} - starting TCPDUMP"
    diskfree=$(df --output=avail / | tail -1)
    if [ $diskthreshold -ge $diskfree ]; then
        logger -t tcpdump "Not enough free disk space to start TCPDUMP."
    else
        tcpdump-run 5 $interface
    fi
fi
[...]
All content © 2021 Internet Systems Consortium, Inc.
Tcpdump-starter Script (3/4)
- the 3rd part checks for the volume of UDP queries
[...]
# test for high DNS UDP request rate
udpqr=$(/usr/sbin/rndc status | grep "recursive clients" | cut -d ':' -f 2 | cut -d '/' -f 1)
if [ $udpthreshold -le $udpqr ]; then
    echo "High UDP DNS Load ${udpqr}"
    logger -t tcpdump "High UDP DNS Load ${udpqr} - starting TCPDUMP"
    if [ $diskthreshold -ge $diskfree ]; then
        logger -t tcpdump "Not enough free disk space to start TCPDUMP."
    else
        tcpdump-run 5 $interface
    fi

fi
[...]
All content © 2021 Internet Systems Consortium, Inc.
Tcpdump-starter Script (4/4)
- the last part checks for the volume of TCP queries
[...]
# test for high DNS TCP request rate
tcpqr=$(/opt/local/bind/sbin/rndc status | grep "tcp clients" |  cut -d ':' -f 2 | cut -d '/' -f 1)
if [ $tcpthreshold -le $tcpqr ]; then
    echo "High TCP DNS Load ${tcpqr}"
    logger -t tcpdump "High TCP DNS Load ${tcpqr} - starting TCPDUMP"
    if [ $diskthreshold -ge $diskfree ]; then
        logger -t tcpdump "Not enough free disk space to start TCPDUMP."
    else
        tcpdump-run 5 $interface
    fi
fi
All content © 2021 Internet Systems Consortium, Inc.
Script tcpdump-run
- The script
tcpdump-runcollects network traffic for some time (5 minutes in this case)
#!/bin/sh
tcpdump -q -W $1 -G 60 -w /pcap/packettrace-%F-%T.pcap -i $2
All content © 2021 Internet Systems Consortium, Inc.
References:
- BIND 9 Logging configuration templates: https://webinar.defaultroutes.de/webinar/bind9-logging-template.html
- BIND 9 ARM - Logging: https://downloads.isc.org/isc/bind9/9.16.5/doc/arm/html/reference.html#logging-statement-definition-and-usage
All content © 2021 Internet Systems Consortium, Inc.
DNS data collection
- DNS-OARC software tools https://www.dns-oarc.net/oarc/software
- DNS witness https://github.com/AFNIC/DNSwitness
- DNS Parse https://github.com/pflarr/dns_parse
- Capture DNS - A simple program to capture and show DNS queries https://github.com/lilydjwg/capture-dns
All content © 2021 Internet Systems Consortium, Inc.
Systemd Journal
- Log Management with the Systemd Journal https://materials.rangeforce.com/tutorial/2020/04/16/Systemd-Journal/
- Forward secure sealing https://lwn.net/Articles/512895/
All content © 2021 Internet Systems Consortium, Inc.
Atop
atophome page https://www.atoptool.nl/- atop – For Linux server performance analysis https://haydenjames.io/use-atop-linux-server-performance-analysis/
All content © 2021 Internet Systems Consortium, Inc.
Upcoming Webinars
- March 17: Session 2. Long-term statistics monitoring and log analysis
- April 21: Session 3. Load balancing with DNSdist
- May 19: Session 4. Dynamic zones, pt1 - Basics
- June 16: Session 5. Dynamic zones, pt 2 - Advanced topics
All content © 2021 Internet Systems Consortium, Inc.
Questions and Answers
All content © 2021 Internet Systems Consortium, Inc.